Results and Discussion |
Data presentation
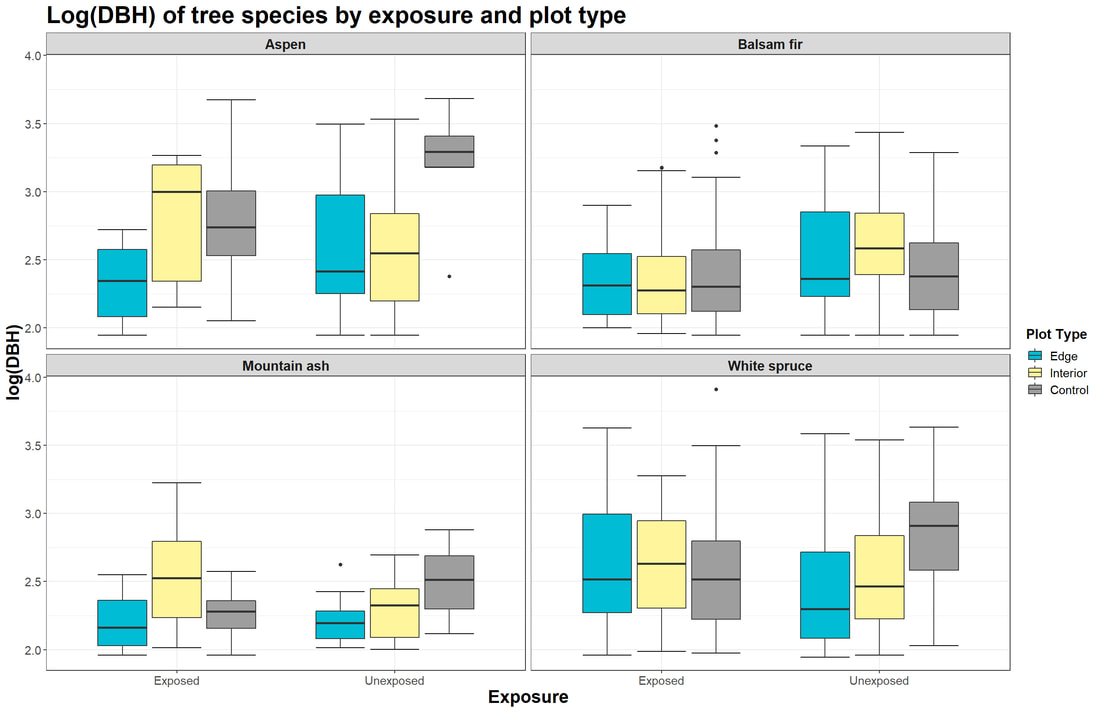
Figure 5. Boxplots displaying the log(DBH) of four tree species (Aspen, Balsam fir, Mountain ash, White spruce) at edge, interior, and control plots for exposed (n=30) versus unexposed plots (n=30).
Results
We samples 1,850 trees at 60 different plots along the north shore of Lake Superior from June to July 2021. Initial analysis of our graphical output (Fig. 5) does not show a clear relationship between the distance of plots inland and the DBH of a given tree species. Distinct relationships in how shoreline exposure affect DBH seem to be lacking as well (Fig. 5). Still, the mean log(DBH) for edge plots was lower than that of interior and control plots for Aspen, Mountain ash, and White spruce. In comparing the means between exposure classes, exposed sites had lower mean DBH for Aspen, Balsam fir, and Mountain ash. A similar lack of stark patterns can be gleaned from our figures in observing the output for mean abundance (Fig. 6). However, mean abundance at edge and interior plots was lower for every species at exposed sites compared to respective unexposed ones (Fig. 6). Interestingly, exposed control plots had higher mean abundance for Aspen, Balsam fir, and Mountain ash compared to unexposed control plots (Fig 6).
We also performed an analysis of species richness by creating rarefaction curves for each of the six treatment combinations in our study (Fig. 7). For both exposed and unexposed sites, species richness was higher at edge plots compared to control plots and edge plots at exposed sites had the highest species richness overall. However, species richness at interior plots remained constant regardless of exposure class (Fig. 7).
We also performed an analysis of species richness by creating rarefaction curves for each of the six treatment combinations in our study (Fig. 7). For both exposed and unexposed sites, species richness was higher at edge plots compared to control plots and edge plots at exposed sites had the highest species richness overall. However, species richness at interior plots remained constant regardless of exposure class (Fig. 7).
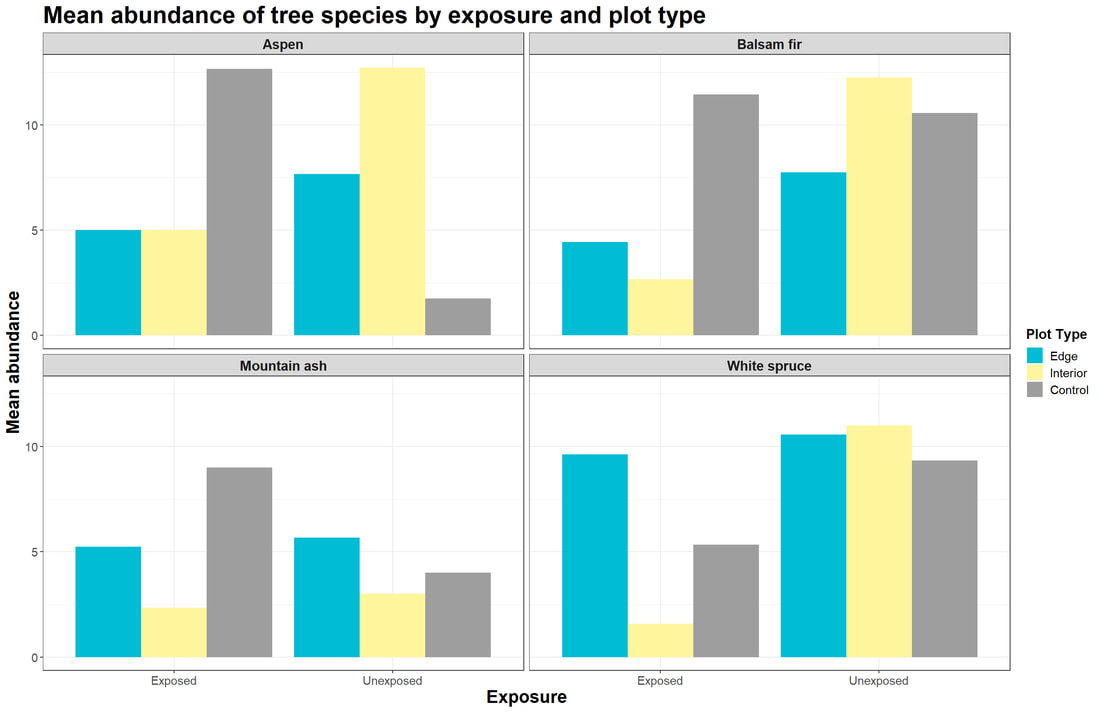
Figure 6. Bar graphs showing the mean abundance of tree species (Aspen, Balsam fir, Mountain ash, and White spruce) at edge, interior, and control plots for exposed (n=30) versus unexposed plots (n=30).
|

Figure 7. Graphs displaying rarefied species richness for edge, interior, and control plots at exposed compared to unexposed sites (n=198). Edge plots are marked in blue, while interior plots are in yellow, and control plots in grey.
|
Analysis of Variance
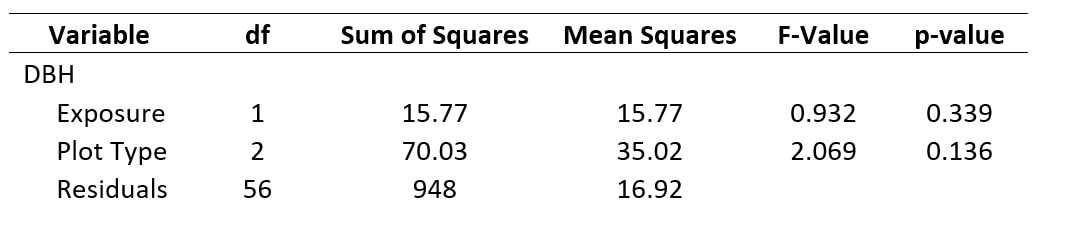
While our data does not meet the assumptions of normality nor homogeneity of variances, this made little difference on the output from our ANOVA tests. This was confirmed by log-transforming our dependent variables in R and comparing the results of that ANOVA to non-transformed data. In either case, when looking at the effect that exposure had on DBH (Table 3), there was no significant effect; plot type also failed to significantly affect DBH (Table 3). While plot type does a slightly better job of influencing the difference in DBH compared to exposure, the "signal : noise" demonstrated by the F-Value is still rather low. In order to try to reconcile the violations of assumptions of normality and homogeneity of variances, we log-transformed our data and plotted the residuals to see if this provided a better fit for our model's explanation of the data. For DBH, log transformations did a better job of improving the residuals as shown by their relatively normalized distribution (Fig. 8). However, the extent to which the residuals improved for individual species abundance was far more variable (Fig. 9).
Table 3. The results of our ANOVA for DBH as a factor of exposure and plot type.
We also performed a separate ANOVA for each of four species of interest - Aspen, Balsam fir, Mountain ash, and White spruce - which were those that were well-distributed at each site. Again, despite log-transforming the data, it made little impact on the outcome of our ANOVA. As with our analysis using DBH as the response variable, no significant effects were found for exposure or plot type on the abundance of our species of interest (Table 4). In the case of our abundance data, there is no clear trend in whether exposure or plot type does a better job of explaining the effects on abundance for a given species. Still, the F-Values remain unremarkable for the test of these variables.
Table 4. Four separate ANOVAs for abundance as a factor of exposure and plot type, separated by species.
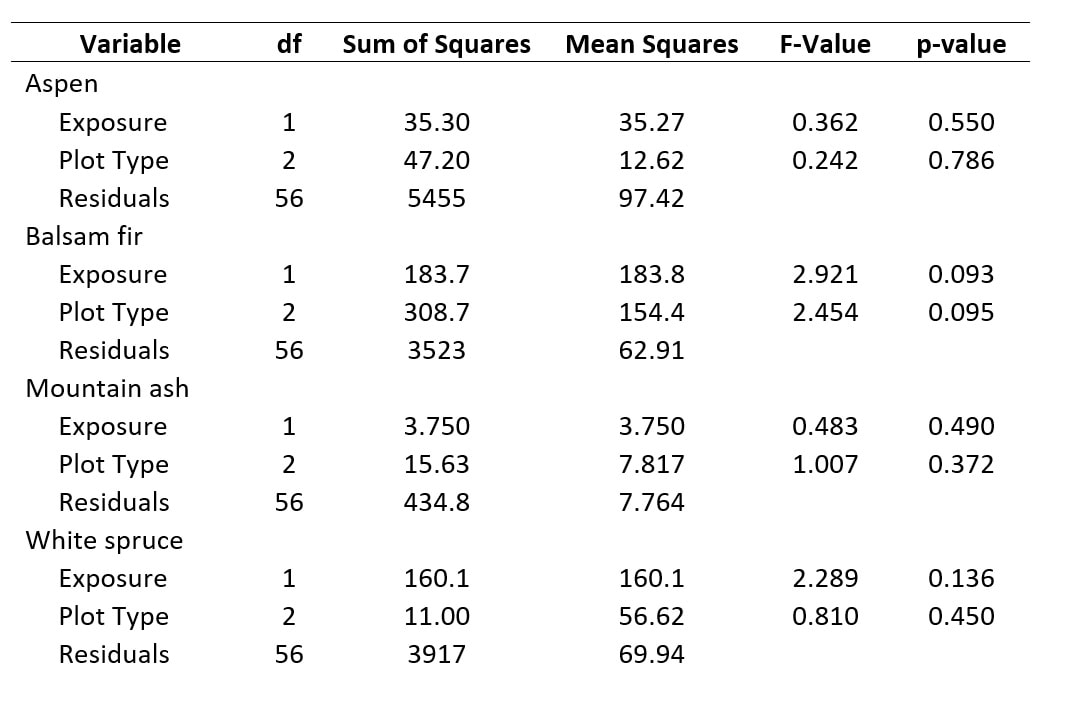

Figure 8. Two residual plots comparing the distribution of residuals of our regular DBH data (left) to their distribution when the DBH data was log transformed (right).
|
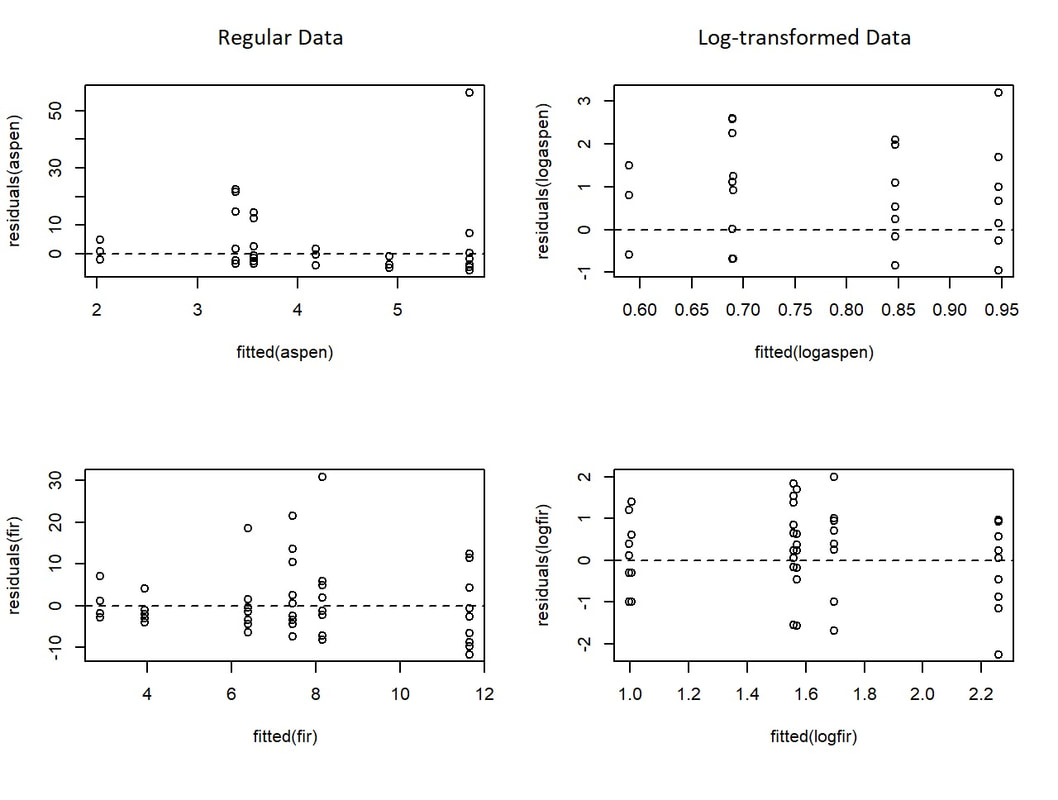
Figure 9. Residual plots comparing the variation in log transformations (right) to the regular data (left). The top rwo displays the transformation being carried out on abundance data for Aspen, while the bottom row shows a much better improvement in the residuals for Fir.
|
Discussion
While we failed to note significant results and no clear trends appear across the species from our graphical output (Fig. 5; Fig. 6), some species-specific patterns seem to exist. There may be a variety of factors that relate to habitat suitability and tree mortality for a given species, so the variation in our results is not entirely surprising. The life history traits of the different trees we sampled may be impacting their abundance and DBH more so than from temperature effects alone. Whether the trees are shade tolerant or not, early successional versus late successional species, and what their competitive strengths are likely impacted the forest structure at our plots.
Further, DBH alone may not be the most appropriate indicator of tree vigor or success. Increment borers yield information about the age and growth rates of trees, which may provide better indications of success (Yang et al., 2003). As we lack data on the age and productivity of the trees that we sampled, our ability to draw conclusions on tree success is limited. Still, we are able to see that smaller white spruce seem to favour the conditions at edge plots regardless of exposure. Additionally, exposure seemed to have an impact on the success of Aspen and Balsam fir at edge plots.
Further, DBH alone may not be the most appropriate indicator of tree vigor or success. Increment borers yield information about the age and growth rates of trees, which may provide better indications of success (Yang et al., 2003). As we lack data on the age and productivity of the trees that we sampled, our ability to draw conclusions on tree success is limited. Still, we are able to see that smaller white spruce seem to favour the conditions at edge plots regardless of exposure. Additionally, exposure seemed to have an impact on the success of Aspen and Balsam fir at edge plots.
In a study on spruce in central Europe, Cienciala et al. (2016) found stronger influences on tree growth from soil nutrients, pH, and moisture compared to from temperature alone. This may explain the considerable variation in the DBH and abundance within and between our sampled species, despite distinct changes in temperature from the shoreline to inland control plots at Lake Superior (Hillman, n.d.; Hinkel and Nelson, 2011). Still, our rarefaction curves (Fig. 7) indicate that edge plots are more diverse than our controls and that exposed edge sites yielded the greatest species richness overall. This may indicate that the microclimate at shoreline edges are indeed providing refugia owing to Lake Superior's cooling effect. However, we lack data on other environmental factors from this area that might result in higher species richness along the shore, such as canopy structure, soil chemistry, and understory plant composition.
Conclusion
Lake Superior's shoreline forests seem to differ in a few ways from the forests further inland; however, the lake's cooling effect alone may not impact forest structure as strongly as we expected. While our results did not reveal strong patterns or trends in forest composition, there are a few observations that seem to indicate that particular species may be responding to the lake's cooling effect. Still, many variables should be considered moving forward to determine the extent to which the lake affects forest microclimates. Consideration paid to tree age and annual growth may yield more evidence for tree success than DBH or abundance on their own. This could indicate whether the microclimate at the shore provides favorable growth conditions for the species that have established there. Further studies should also consider soil characteristics such as nutrients and pH, as well as moisture levels, in order to determine if other edaphic or climatic factors are influencing forest microclimates beyond temperature alone.
References
- Ashcroft, M. B. (2010). Identifying refugia from climate change.
- Cienciala, E., Russ, R., Šantrůčková, H., Altman, J., Kopáček, J., Hůnová, I., Štěpánek, P., Oulehle, F., Tumajer, J. and Ståhl, G. (2016). Discerning environmental factors affecting current tree growth in Central Europe. Science of the Total Environment, 573, 541-554.
- Given, D. R., & Soper, J. H. (1981). The artic-alpine element of the vascular flora at lake superior (No. 581.9 GIV).
- Hillman, A. (n.d.). [Unpublished doctoral dissertation]. University of Alberta.
- Hinkel, K. M., & Nelson, F. E. (2012). Spatial and temporal aspects of the lake effect on the southern shore of Lake Superior. Theoretical and Applied Climatology, 109(3), 415-428.
- Morelli, T.L., Daly, C., Dobrowski, S.Z., Dulen, D.M., Ebersole, J.L., Jackson, S.T., Lundquist, J.D., Millar, C.I., Maher, S.P., Monahan, W.B. and Nydick, K.R. (2016). Managing climate change refugia for climate adaptation. PLoS One, 11(8), e0159909.
- Stralberg, D., Arseneault, D., Baltzer, J.L., Barber, Q.E., Bayne, E.M., Boulanger, Y., Brown, C.D., Cooke, H.A., Devito, K., Edwards, J. and Estevo, C.A. (2020). Climate‐change refugia in boreal North America: what, where, and for how long?. Frontiers in Ecology and the Environment, 18(5), 261-270.
- Yang, Y., Titus, S. J., & Huang, S. (2003). Modeling individual tree mortality for white spruce in Alberta. Ecological Modelling, 163(3), 209-222
